Employee KPI Reviews — How to Track Performance Without Spreadsheets
2026-05-09
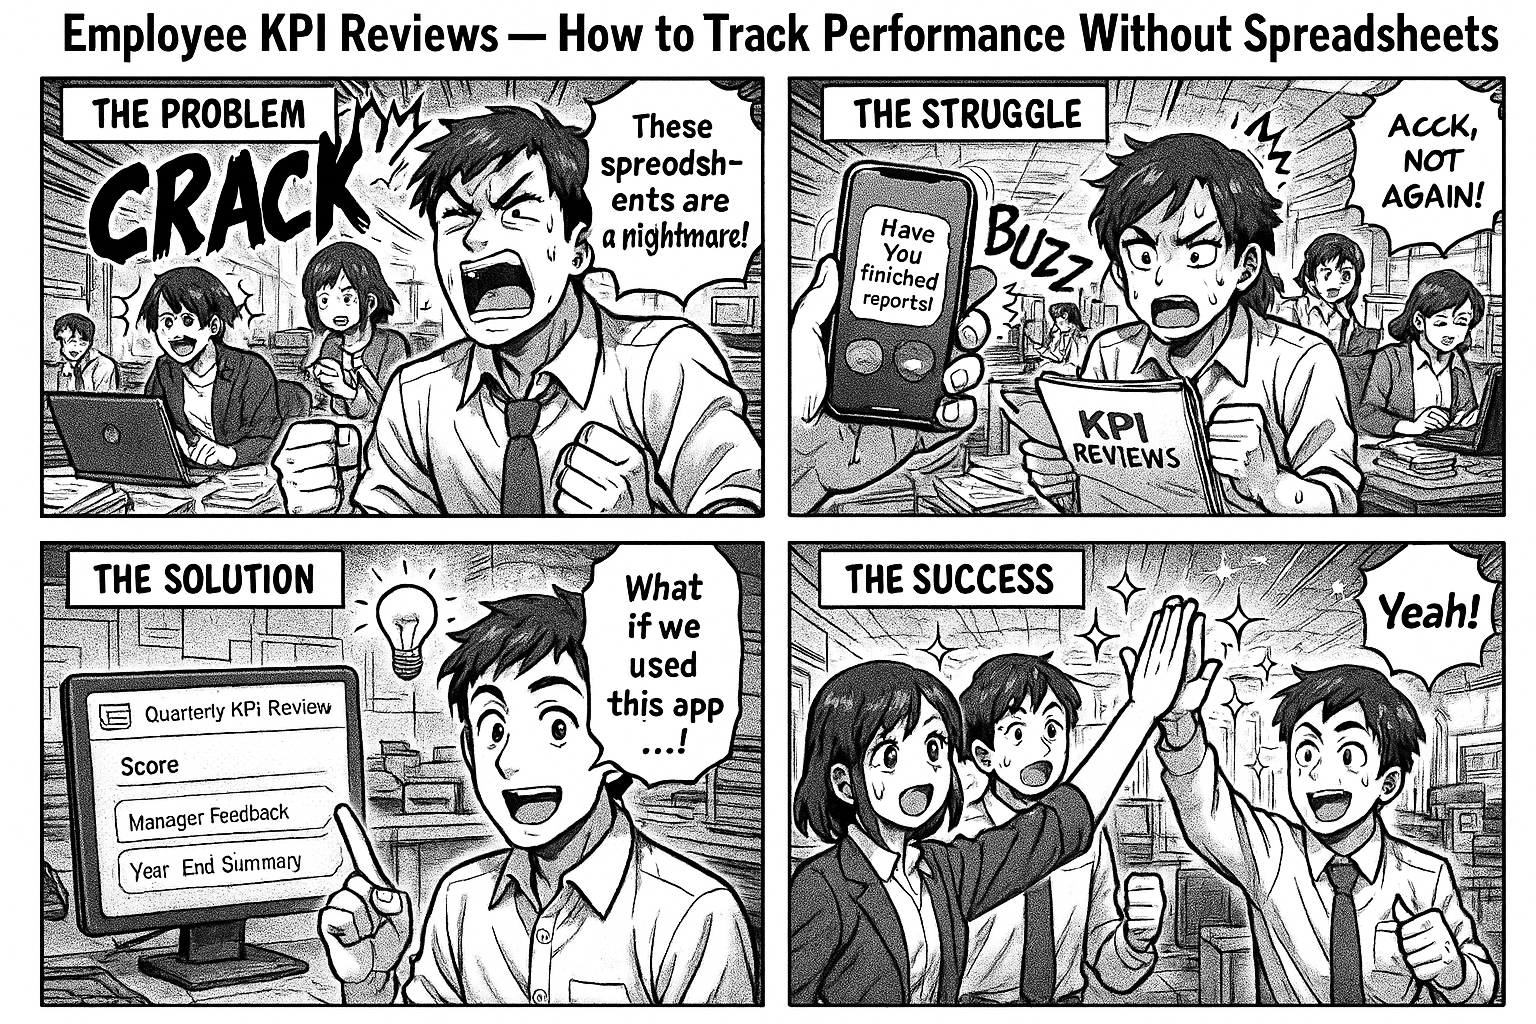
Digitize quarterly KPI reviews with automated scoring, manager feedback, and year-end summaries — no more spreadsheet-based appraisals.
Every quarter, managers sit down to review their team's KPIs. The process involves Excel sheets emailed back and forth, scores entered manually, and a final summary that takes days to compile.
By year end, nobody has a clear picture of how each employee performed across all four quarters.
The Spreadsheet Problem
1. No Single Source of Truth
Q1 scores are in one Excel file. Q2 in another. Q3 was done on paper because the Excel got corrupted. Q4 is pending because the manager is traveling.
2. No Audit Trail
Who entered the scores? When were they reviewed? Did the employee see their feedback? Nobody knows.
3. No Year-End View
When it's time for annual appraisals, HR asks managers to compile a summary. Managers scramble to find old files. Some scores are missing. The summary is incomplete.
4. No Accountability
KPIs are set in April. By July, nobody remembers what was agreed. By December, the goals have changed but the tracking hasn't.
The Digital KPI Review Process
Step 1: Set KPIs
Manager and employee agree on KPIs at the start of each cycle:
- KPI description (what to achieve)
- Category (Quality Output, Compliance, Team Development, Efficiency)
- Category weight (e.g., Quality = 40%, Compliance = 20%)
Step 2: Self Evaluation
At the end of the cycle, the employee fills in:
- What they achieved against each KPI
- Self-evaluation comments
- Supporting data or evidence
Step 3: Manager Evaluation
Manager reviews the self-evaluation and enters:
- Score per KPI (percentage)
- Manager feedback and remarks
- Overall assessment
Step 4: Review & Acceptance
Employee sees the manager's scores and feedback. Can add acceptance comments. The cycle closes.
What the Dashboard Shows
Select any employee and see:
Profile: Name, designation, department, employee code
Year Summary: 4 reviews, Average Score: 91%
Per Quarter:
| Category | Weight | Score | Manager Feedback |
|---|---|---|---|
| Quality Production Output | 40% | 87% | Analysis shall be controlled |
| Efficiency Improvement | 30% | 79% | Equipment utilization needs increase |
| Compliance & Audits | 20% | 88% | Observations closed on time |
| Self & Team Development | 10% | 85% | Training should increase |
Average: 85%
All scores are color-coded: green (90%+), amber (75-90%), red (below 75%).
Why This Matters
1. Instant year-end summary — no compilation needed. Select employee, see all quarters.
2. Consistent categories — same KPI types across all employees. Easy to compare.
3. Manager accountability — every score has a timestamp and feedback. No anonymous ratings.
4. Employee visibility — employees see their scores and feedback. No surprises at appraisal time.
Set It Up
Go to insights.flobri.com/build and describe your process:
"Manager sets KPIs for employee with categories and weights. Employee does self-evaluation. Manager scores each KPI with feedback. Employee reviews and accepts. Quarterly cycle."
Flobri digitizes KPI reviews — from goal setting to manager scoring to year-end summaries — with full audit trails and instant performance dashboards.