Why Your Factory's Best Output Numbers Are Buried in Spreadsheets
2026-05-29
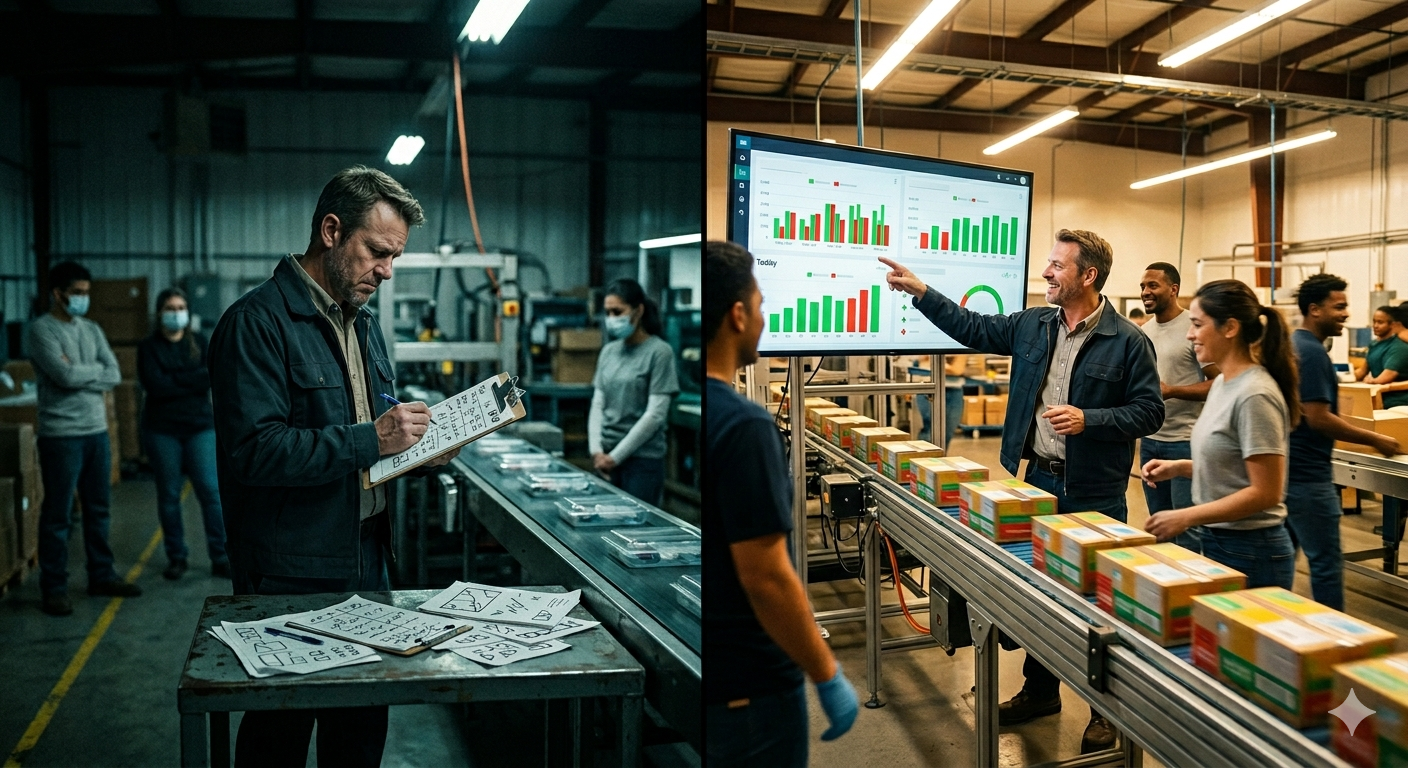
Every factory has a best-ever output for each product and line. But nobody tracks it systematically. When today's output drops 40% below the best, who notices? Here's how to automate production benchmarking.
Why Your Factory's Best Output Numbers Are Buried in Spreadsheets
Somewhere in your factory's history, Line 2 packed 1,859 units of Bactafuz Cream per person in an 8-hour shift. It was a Tuesday. The team was in sync. The machine ran clean. Everything clicked.
That number is your benchmark — the proof of what's possible on that line, with that product, at that pack size.
But does anyone know that number today? Is it written down anywhere? When Line 2 does 1,100 units tomorrow — a 40% drop — will anyone notice?
In most factories, the answer is no.
The Invisible Benchmark Problem
Every production line has a best-ever output. It's the peak performance achieved under real conditions — not a theoretical target, but an actual result with real people, real machines, and real material.
The problem is that this number lives nowhere useful:
- In someone's memory — "I think we did 2,000 units once" (was it per shift? Per person? Which pack size?)
- In a spreadsheet — buried in row 847 of a file last opened in March
- Nowhere at all — nobody tracked it because nobody thought to
Without a systematic benchmark, you can't answer the most important production question: "Are we performing at our best today, or are we leaving output on the table?"
What Happens Without Benchmarking
Underperformance Goes Unnoticed
If your best-ever output per person is 1,859 and today you did 1,100, that's a 41% drop. But if nobody tracks the benchmark, today's 1,100 looks... normal. It becomes the new normal. Next month, 900 becomes normal. The slide is invisible because there's nothing to compare against.
Root Causes Stay Hidden
A 40% drop doesn't happen randomly. Something changed — staffing mix, machine condition, material quality, batch size. But without the comparison, there's no trigger to investigate. The question "why was today worse than our best?" never gets asked.
Planning Uses Wrong Numbers
Production planning should be based on demonstrated capability, not wishful thinking or pessimistic averages. If you've proven you can do 1,859 per person, planning for 1,200 means you're systematically under-scheduling. Planning for 2,500 means you're over-promising.
The Right Way to Track Production Benchmarks
Step 1: Capture Output Per Person, Not Just Total Output
Total output is misleading. If Line 2 produced 15,000 units with 10 people in 8 hours, that's 1,875 per person. If it produced 15,000 with 15 people, that's 1,000 per person. Same total, very different efficiency.
The right metric:
Output Per Person Per 8hr Shift = (Total Output / (Staff + Contractors) × Work Hours) × 8
Step 2: Track by Product + Line + Pack Size
The benchmark for "Bactafuz Cream 5GM on Packing Line 2" is different from "Bactafuz Cream 10GM on Packing Line 3". Each combination needs its own benchmark.
Step 3: Auto-Update the Benchmark
Every day, compare today's output per person against the stored benchmark. If today's number is higher, update the benchmark. The best-ever number ratchets up automatically.
Step 4: Flag Underperformance Automatically
When today's output drops below 80% of the benchmark, flag it. Don't wait for someone to notice in a weekly review. Send the alert to the plant head the next morning:
"29 May 2026: Bactafuz Cream PACKING Line-2 output is 41% less than optimal. Recorded: 1,100/person/8hr. Best: 1,859/person/8hr."
Now the plant head knows exactly what happened, where, and how far off it was. They can investigate before the next shift starts.
What a Good Benchmarking System Looks Like
| What | How |
|---|---|
| Data source | Capacity allocation entries (what was packed, by how many people, for how many hours) |
| Benchmark table | One row per product + line + pack size combination with the best-ever output |
| Daily comparison | Automated — runs every morning, compares yesterday's entries against benchmarks |
| Alert threshold | Output < 80% of best → flag to plant head |
| Benchmark updates | Automatic — if today beats the record, the benchmark updates |
Common Pitfalls
Inconsistent Data Entry
If one person enters pack size as "5GM" and another enters "5 GM" or "5gm", the system treats them as different products. You end up with three benchmarks for the same thing, none of them accurate. Normalize inputs at entry time — uppercase, no spaces, always.
Ignoring Work Hours
Comparing an 8-hour shift to a 12-hour shift without normalizing to per-hour output gives meaningless benchmarks. Always normalize to a standard shift length.
Setting Targets Instead of Tracking Actuals
The benchmark should be what you actually achieved, not what you think you should achieve. Actual benchmarks are credible — when you tell a plant head "you've done 1,859 before on this exact line with this exact product," they can't argue with it. Theoretical targets invite debate.
Not Accounting for Pack Size
The same product in different pack sizes has very different output rates. 5GM tubes pack faster than 100GM tubes. Track each pack size separately.
The Business Impact
Factories that implement automated benchmarking typically find:
- 15-25% of shifts are significantly below benchmark — opportunities that were previously invisible
- Root cause identification within 24 hours instead of weeks (or never)
- Natural performance improvement just from visibility — teams perform better when they know the benchmark exists
- Better production planning — scheduling based on demonstrated capability, not guesswork
Getting Started
You don't need expensive MES software. You need:
1. A table of best outputs — one row per product + line + pack size, with the best-ever output per person
2. A daily job that compares yesterday's actual output against the table
3. An alert when actual < 80% of best, sent to the plant head
4. Auto-update when a new best is recorded
The data is already in your system — production entries, staff allocation, work hours. You just need to compare today against the best of the past.
The difference between a factory that improves and one that drifts is usually just one question asked every morning: "How did we do compared to our best?"
Flobri automatically tracks production benchmarks per product, line, and pack size — and alerts plant heads when output drops below the best-ever threshold. See how it works →